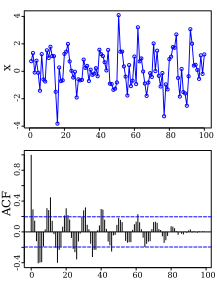
Above: A plot of a series of 100 random numbers concealing a sine function. Below: Its correlogram plots the autocorrelation function (ACF) of the series on the y-axis for every lag on the x-axis. Peaks occur at lags where the series is highly correlated with itself. Peaks to the right of the initial peak at lag 0 indicate periodicity in the series and help estimate the concealed sine’s period.
(echo:: @ ᯤ)