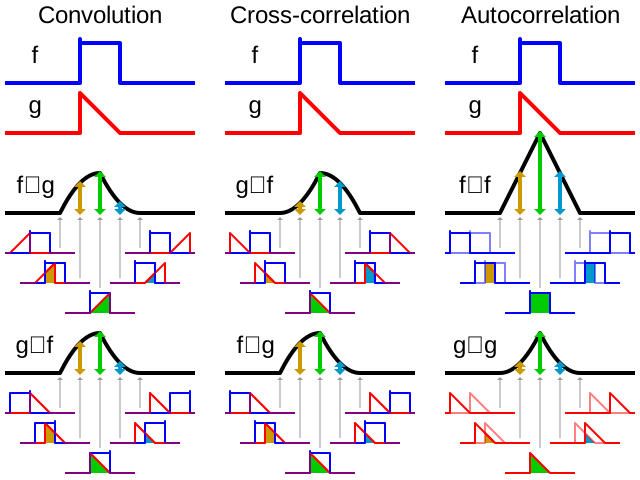
Visual comparison of convolution, cross-correlation, and autocorrelation. For the operations involving function f, and assuming the height of f is 1.0, the value of the result at 5 different points is indicated by the shaded area below each point. Also, the symmetry of f is the reason and are identical in this example.
(echo:: @ ᯤ)