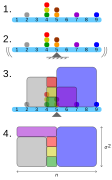
Geometric visualisation of the variance of an arbitrary distribution (2, 4, 4, 4, 5, 5, 7, 9):
- A frequency distribution is constructed.
- The centroid of the distribution gives its mean.
- A square with sides equal to the difference of each value from the mean is formed for each value.
- Arranging the squares into a rectangle with one side equal to the number of values, n, results in the other side being the distribution’s variance, σ 2.
(echo:: @ ᯤ)